When I took my driving licence road test, the first thing they grade you on is how you stop at a crosswalk. Stop at the stop line. Make sure you can see the crosswalk clearly. If you don’t, you’re not getting your licence. The stop line exists so that the crosswalk stays clear. Then why am I, a pedestrian in New York City, plagued by drivers who don’t follow Rule Number One? I often find myself navigating a maze of cars on a crosswalk. What’s going on?
I decided to investigate. Over 24 hours at six Manhattan intersections I confirmed 456 vehicles standing in a crosswalk — one every 20 minutes at each intersection I watched. That’s a pedestrian forced to veer into a live traffic lane, over and over, all day.
1. The rule, and what it actually says
In New York City this is not a matter of etiquette. It is documented, and it says precisely what this inquiry measures. Under the City’s Traffic Rules, 34 RCNY §4-03(a)(3)(i)1, at a steady red signal:
Vehicular traffic facing such signal shall stop before entering the crosswalk on the near side of the intersection or, if none, then before entering the intersection and shall remain standing until an indication to proceed is shown.
The rule protects the walking surface specifically.
A second provision covers the driver who enters on green and is then stranded — 34 RCNY §4-07(b)(2)1, “Spillback”:
No operator shall enter an intersection and its crosswalks unless there is sufficient unobstructed space beyond the intersection and its crosswalks in the lane in which he/she is traveling to accommodate the vehicle, notwithstanding any traffic control signal indication to proceed.
This is what we call an impatient driver. Selfish behaviour in our city.
State law is narrower. VTL §11752 covers only entering an intersection when traffic is already stopped on the far side, and expressly excepts turning vehicles.
The penalty is $115. The NYC Department of Finance schedule sets that amount for violation code 50 (crosswalk) and code 52 (intersection). The same in Manhattan below 96th Street as everywhere else3. For scale, that is roughly two hours in a Midtown parking garage.
Two distinct infractions here:
- Stop-line encroachment: the vehicle is past the line. Illegal.
- Crosswalk encroachment: the vehicle is in the crossing itself. Illegal, and it puts pedestrians into moving vehicular cross-traffic.
2. Why this matters here, in NYC
New York is a city of pedestrians, cyclists, transit users, rats, horses, and a whole lot of other things, but one thing it is not, is a city of drivers. The majority of the city do not drive about.
| Borough | Households with no vehicle |
|---|---|
| Manhattan | 78.5% |
| Bronx | 62.1% |
| Brooklyn | 58.6% |
| Queens | 38.9% |
| Staten Island | 16.7% |
| New York City | 56.7% |
In Manhattan, 633,924 of 807,083 households do not have a motor vehicle. Commuting tells the same story: of 914,910 Manhattan workers, 51.0% travel by public transport and 18.3% walk, while 6.3% use a car, truck or van, with 5.2% of them driving alone4.
U.S. Census Bureau, American Community Survey 2024 1-year estimates, tables B08201 and B08301, New York County. Retrieved 13 August 2026.
That asymmetry is what frustrates me. A vehicle standing in a crosswalk takes space from the 78% in order to serve a trip type accounting for about one commute in sixteen.
And the cost is not evenly distributed. When a vehicle occupies a crossing, the person on foot does not stop and wait, they have to step around it, into a live traffic lane. A wheelchair user cannot mount a kerb mid-block to get around a bumper. A blind pedestrian following a tactile path will find it blocked by an object that refuses to yield. A parent with a stroller, and this is quite a common sight, has to choose between crossing the road or waiting for the next traffic cycle hoping for a safer route.
In 2024 the NYPD recorded 91,316 collisions in New York City, in which 9,616 pedestrians were injured and 124 were killed5. Among collisions that injured a pedestrian, the most frequently recorded contributing factors were driver inattention or distraction (2,301) and failure to yield right of way (2,165).
How much of this is a result of pedestrians forced into unsafe traffic lanes due to blocked crosswalks, I do not know, and there is no data for this. I cannot prove it either way, but it’s certainly not that hard to imagine how a blocked crosswalk does not help make the city a safer place for the majority of its residents.
The absence of this data is itself part of my argument.
NYPD Motor Vehicle Collisions – Crashes, NYC Open Data (h9gi-nx95), calendar year 2024. Queried 13 August 2026.
3. What I measured
Over twenty-four hours I collected 144.6 camera-hours of footage at six Manhattan intersections: five on Park Avenue and one on 9th Avenue — 253,451 frames in all.
The machine put forward 1,000 candidate vehicle-stops in total. Of those, 677 cleared the four-frame stillness test I use as the bar for an infraction; the remaining 323 were briefer stops, and §4 explains what happened to them.
I then sat and watched every one of the 1,000 and gave each a verdict by eye. Not a sample of them — all of them. Among the 677 that met the bar I confirmed 456 as genuine and rejected 221, so the machine was right 67% of the time and you are not being asked to take the other 221 on trust.
Every number in this piece is built on those 456 confirmed infractions only. Nothing is scaled up, corrected, or extrapolated from an unreviewed remainder, because there is no unreviewed remainder. These are a floor, not an estimate — see the limitations in §5 for why the true number is higher.
| Intersection | Hours | Confirmed | Confirmed /hr |
|---|---|---|---|
| Park Ave @ 34 St | 24.1 | 121 | 5.02 |
| Park Ave @ E 116 St | 24.1 | 103 | 4.27 |
| Park Ave @ 23 St | 24.1 | 100 | 4.15 |
| Park Ave @ 96 St | 24.1 | 66 | 2.74 |
| Park Ave @ 86 St | 24.1 | 34 | 1.41 |
| 9 Ave @ 23 St | 24.1 | 32 | 1.33 |
| All sites | 144.6 | 456 | 3.15 |
Park Ave @ 34 St is a notable intersection because it is usually always blocked by a vehicle, and the data backs it up.
When it happens
Confirmed infractions by hour of day. Each faint line is one intersection; the highlighted line is the mean across all six.
The quiet block runs from about 01:00 to 09:00 and averages under ten confirmed infractions an hour across all six intersections put together, bottoming out at four in the whole 07:00 hour. From 10:00 it roughly triples and stays up — noisily, with a real dip around 18:00 — and then peaks in the 22:00 hour at 46 confirmed infractions, the busiest of the entire day.
That late peak is worth sitting with. This is not a rush-hour phenomenon, and it is not about darkness making drivers careless — it is heaviest when the streets are still busy but the pressure of the commute has gone.
I was recording evenly throughout: every hour carries between 10,098 and 11,403 frames, so the shape is not an artefact of when I happened to be watching. But 456 infractions spread over 24 hours and six intersections leaves only a handful in each hour, so read the shape rather than any single point.
How long they sit there
The obvious objection is that I’m counting cars that were simply passing through and got caught mid-frame. So I measured how long each one actually stayed.
How long each vehicle stayed in the crossing. The curve is the share of the 456 confirmed infractions still in the crossing after a given number of seconds.
The median is 26 seconds — not a car caught mid-turn, a car standing there. 399 of them (88%) held still for 10 seconds or more, and 197 (43%) for over 30 seconds. The longest was 103 seconds: nearly two minutes of a crossing held shut by one bus.
So the “just passing through” objection does not survive contact with the data. It cannot, by construction — a vehicle has to be measurably motionless for four consecutive frames before it is even a candidate, so anything genuinely rolling through never enters this distribution at all. What you are looking at is the distribution of sustained stops, and its centre of mass is around half a minute.
How far in they are
The other objection might be that I’m flagging cars that barely clipped the line.
Every one of the 456 confirmed infractions, drawn onto a single crossing seen from above. Each dot is one vehicle’s deepest contact point with the road. The six intersections have different geometry, but the same rectification that measures them also makes them comparable, so they can all be placed on one idealised crossing.
Every dot is past the stop line and inside the crossing. 26% are at least a quarter of the way across, and 59 of them are past halfway. 41 are three-quarters across, close enough to the far kerb that a pedestrian has to walk into active traffic lanes to even start the crossing. The median sits at 0.09, just inside the near edge: the classic creep past the stop line.
Look at the horizontal spread too. You’ll see a small concentration on the right, which are vehicles positioned to turn right, but encroach on the crosswalk.
4. How did I do it?
As much as I’d love to camp out with a deck chair and watch traffic with a clipboard, I do have other parts to watch over (blocked bus and bike lanes, I’m coming for you next). I polled the DOT cameras readily available, scouted for intersections which give me a clear view of the crosswalk and stop line, and started recording. I used a machine vision tool to make sense of the video frames and that data helped detect the initial set of infractions recorded. I then manually checked every machine ‘flagged’ infraction to ensure I was collecting the data correctly. Although there were a few false positives (cars on the crosswalk waiting to go through a blocked intersection on green, vehicles waiting to turn), it’s almost a certainty I’ve undercounted the infractions.
The data
Public still images from NYC DOT traffic cameras (webcams.nyctmc.org), 352 ×
240 pixels, refreshing every 2.0 seconds. No private feeds, no additional hardware, no access beyond what any
member of the public has. The whole system runs on one desktop computer (thrifted from Goodwill, thanks for asking).
Hand-marked geometry
Everything downstream depends on a human drawing the crossing correctly, once per camera to inform the machine what it’s looking at. This tells the machine what is a crosswalk, and what is a vehicular traffic lane.
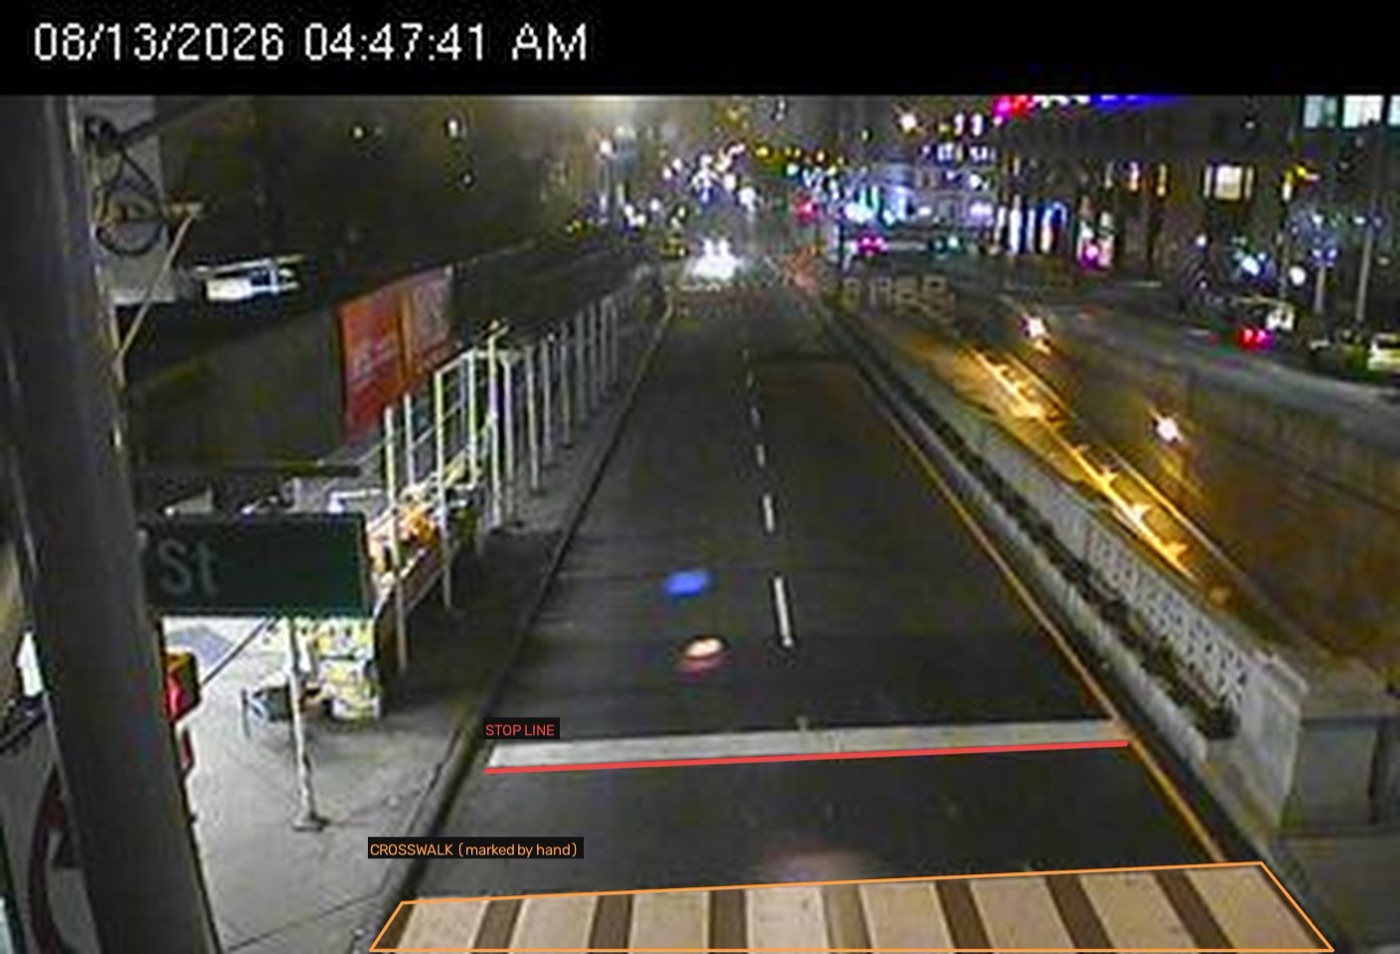
Park Ave @ 34 St
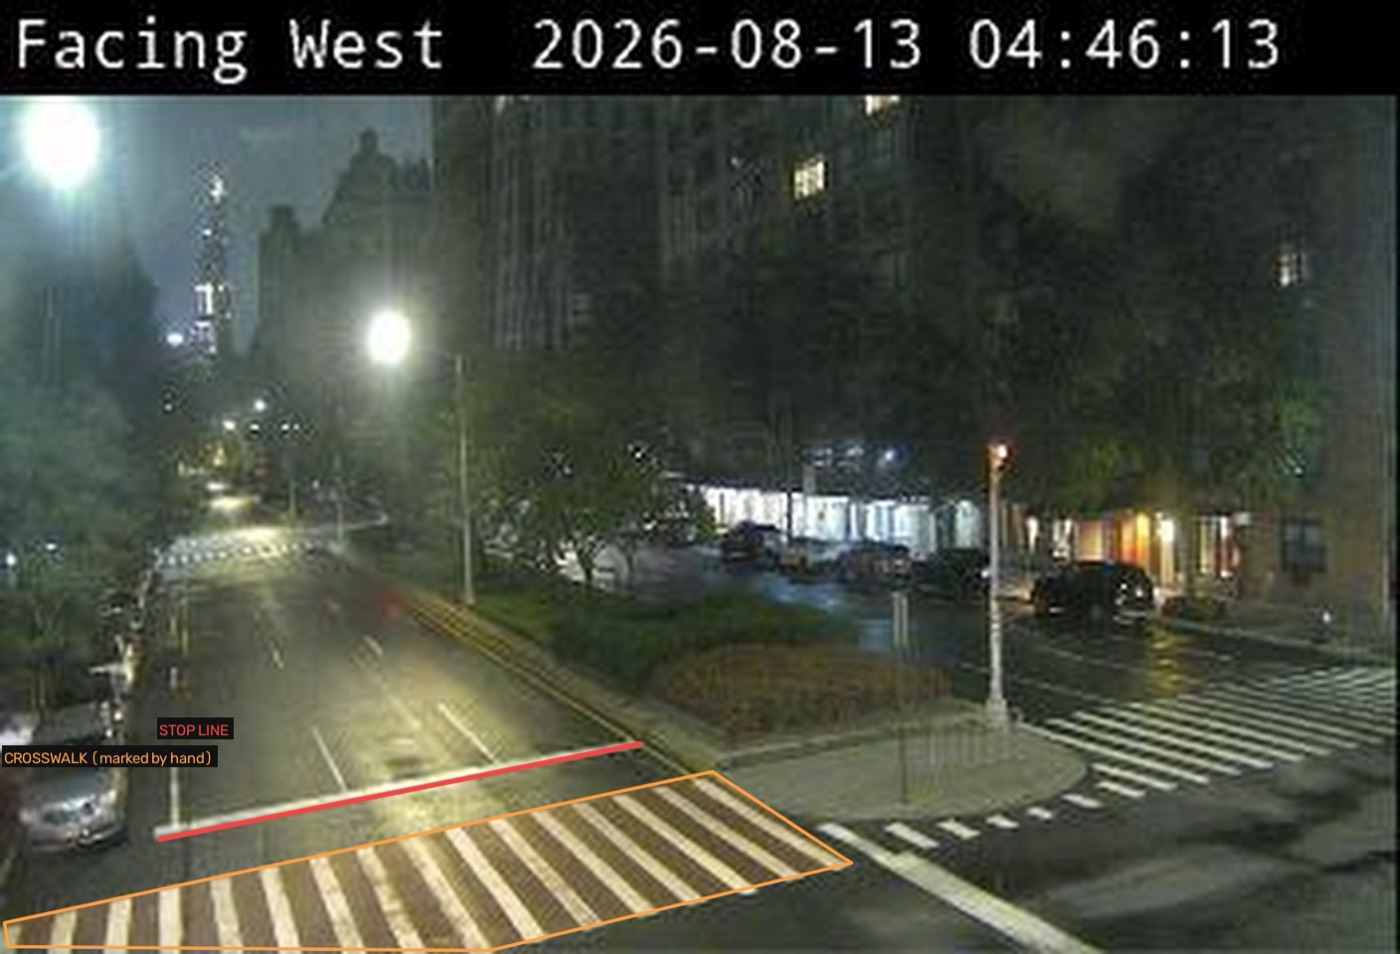
Park Ave @ 86 St
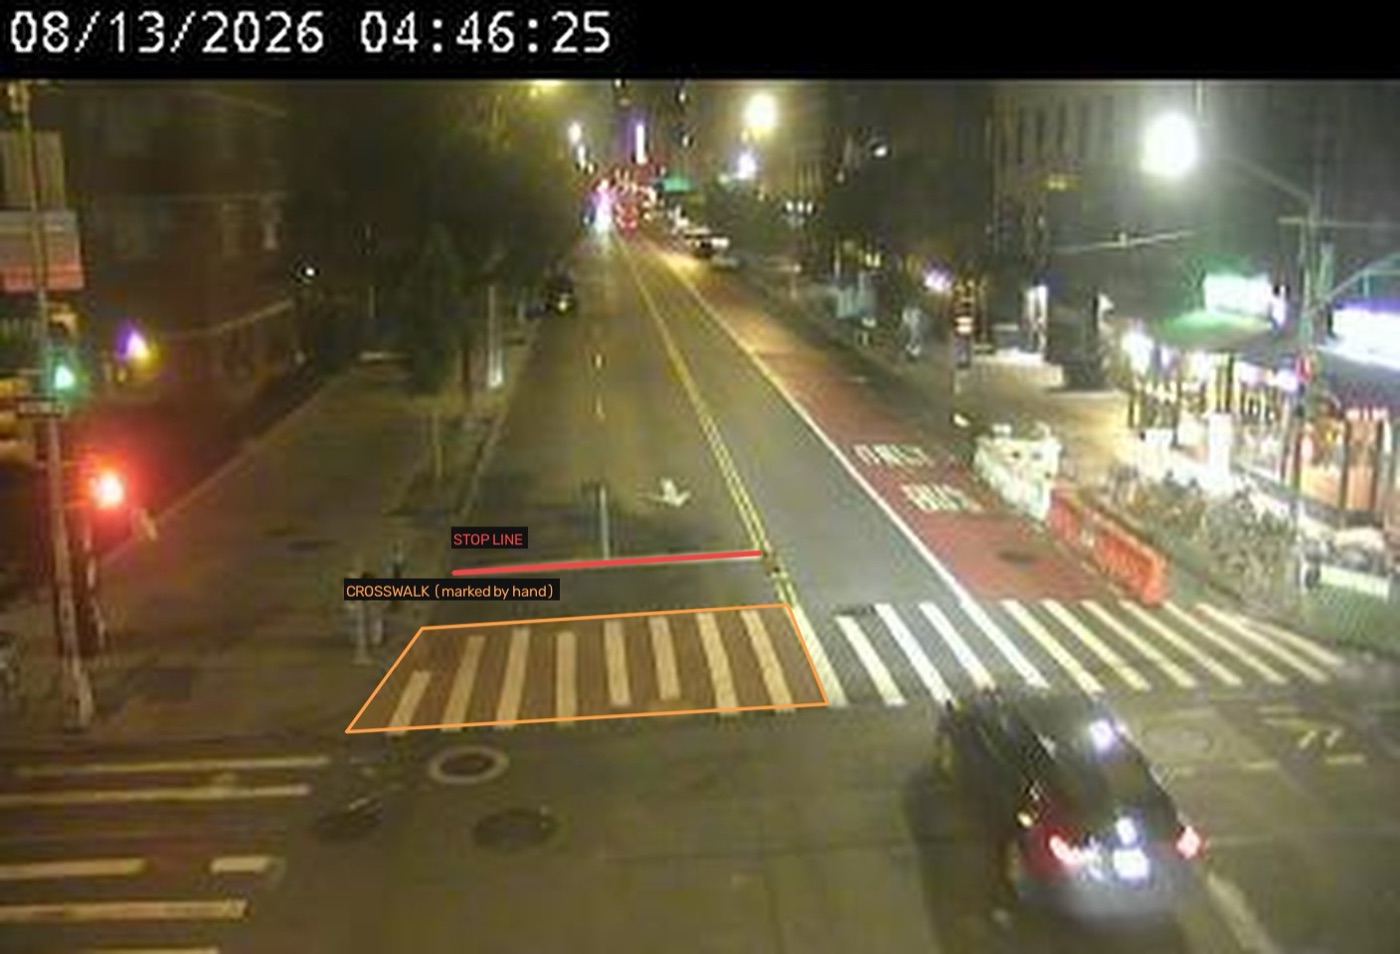
9 Ave @ 23 St
The rule the machine applies
Once the geometry is drawn, the test is embarrassingly simple, and deliberately so. For every vehicle the detector finds, I take the point where it touches the road — not the centre of its box, which floats up as a vehicle gets closer — and project that point onto a flat, overhead view of the crossing. Everything after that is measured in crosswalk-widths, not pixels, so a car at the far end of the street and a car under the lens are judged by the same yardstick.
Then, in order:
- Did it cross the stop line? If the contact point is past the line and inside the marked crossing, it starts being watched.
- Did it stop? I follow it frame to frame. If it holds still — drifting less than 0.15 of a crosswalk-width, roughly two feet — for four consecutive frames, it becomes a candidate. At one frame every two seconds that is about eight seconds of a vehicle not moving while sitting on a crossing.
- When did it leave? I keep watching until it moves off and clears the crossing, and only then close the record.
The third step is what fixes the problem that wrecked my first attempt. Counting frames that look wrong counts the same stopped car over and over: one car sitting through a light produced a dozen “incidents”. Counting vehicle-stops cannot, because a vehicle is entered once, when it arrives, and closed once, when it leaves. One stopped car, one row. Duplicates are not filtered out afterwards; they are impossible to create in the first place.
Only cars, trucks, buses and motorcycles count. Bicycles are detected but never counted as infractions — they were 8% of what the detector was finding, and a bicycle in a crossing is not the thing this paper is about.
Why four frames and not one? Because I tested it. I reviewed the shorter stops too — 323 vehicles that held still for only two or three frames — and just 27 of them were real, a hit rate of 8%. At four frames and above the hit rate is 67%. Below four frames the machine is mostly picking up detector jitter on moving vehicles, so four is where the measurement starts being worth anything. The cost of that choice is real, and it runs one way: some genuine short blockages are now invisible to me.
What the machine sees
Each clip below is an incident that I confirmed as genuine. Nothing here is an unreviewed machine guess. Publishing one as an example of the behaviour would misrepresent the very error rate this inquiry is at pains to state.
Boxes are drawn by the detector. The thick red box is the offender — the vehicle that crossed the stop line and then stopped, the one whose stationary frames were counted. Green is another vehicle, amber a person, grey a detection discarded as unreliable. The blue line is the hand-marked stop line; the shaded quadrilateral is the hand-marked crossing.
Each loop covers the whole stop, start to finish, sampled evenly across it. The caption counts seconds from the moment the vehicle came to rest. You are watching the entire thing, not a favourable few seconds of it.
Park Ave @ 34 St, Thursday 13 August, 10:19 — 56 seconds. A bus, so there is no arguing about where its edges are, stationary at 0.87 of the way across the crossing for nearly a minute. This is also the busiest of my six sites: 121 confirmed infractions in 24 hours. Note that this camera frames the crossing right at the bottom edge of its view — the geometry is still measurable, but you are seeing less of the crosswalk than at the other sites.
Park Ave @ 23 St, 11:12 — 52 seconds. Halfway across the crossing, mid-morning, in clear light. This is the median case, more or less: not spectacular, just constant.
9 Ave @ 23 St, 13:47 — 65 seconds. The one non-Park Avenue site, and the quietest of the six at 1.33 confirmed infractions an hour. Quietest is not clean: this vehicle sits at 0.71 depth for over a minute, and anyone crossing while it does has no clear path at all.
Park Ave @ E 116 St, 15:00 — 68 seconds. We’ve all been here before. The system counts people in the crossing but makes no attempt to identify them, and no image is retained at a resolution where that would be possible.
Park Ave @ 96 St, 20:03 — 103 seconds. The longest single blockage I recorded. A bus, stationary in the crossing for the better part of two minutes. Every number in this paper has a worst case, and this is it.
Park Ave @ 96 St, 21:25 — 58 seconds, and the furthest in. Its contact point sits 0.99 crosswalk-widths past the near edge: it drove through essentially the entire crossing and stopped there. Nothing in the confirmed set goes deeper. How does this person have a licence?
Park Ave @ 23 St, Wednesday 12 August, 22:23 — 50 seconds. The 22:00 hour is the single worst of the day across all six intersections. This is what that peak is made of. Love to see the ‘reverse of shame’.
Park Ave @ 86 St, 01:37 — 52 seconds. The quietest hours are not empty hours. Also an honest look at what detection is working with after dark: grainier, lower contrast, and the reason night is the weakest part of this measurement.
5. AI vs machine learning
No generative AI was used in the detection of the infractions. Open-source, deterministic machine vision libraries were used for the initial infraction screening. I did not train the machine learning model, but it has been trained to detect and differentiate objects.
Everything downstream is deterministic. The geometry is trigonometry. The dwell test is arithmetic on positions. Given the same frames and the same hand-drawn calibration, the pipeline returns the same answer every time.
Known limitations
The most important one first, because it decides how every other number in this paper should be read.
- I know how often the machine was wrong. I do not know how often it was blind. I checked all 677 candidates it produced, so I can tell you it was right 67% of the time. What I cannot tell you is how many real infractions it never put forward at all — that would mean watching all 253,451 frames by hand, and I haven’t. I know some were missed: there are frames with a vehicle plainly in the crossing that belong to no candidate, because the detector lost it for too long to keep the thread. So 456 is a floor. The honest phrasing is “at least 456”, and every rate, projection and dollar figure downstream inherits that word.
- The four-frame threshold throws away short blockages. A vehicle that sits in the crossing for six seconds and moves off is real, is illegal, and is invisible here. That was a deliberate trade — see §4 — but it is a trade.
- Night and dusk are harder. Image quality degrades sharply as light falls. Dark-hour candidates are both fewer and less reliable, which cuts in both directions and I cannot separate the two.
- Under-count by design. Detections that are truncated, tiny, or far from the camera are discarded rather than guessed at.
- Six busy Manhattan avenues are not New York. These sites were chosen for camera quality and a clear view of the crossing, not to be representative.
- I do not identify vehicles or people. No licence plates are read, the resolution makes it impossible, and I would not do it if it were possible. No vehicle is tracked between cameras. Nothing is submitted to any enforcement channel.
6. What this would mean at scale
Using only the confirmed rate of 3.15 infractions per camera-hour, a single intersection sees roughly 76 confirmed infractions per day, or about 27,625 per year. No correction, no scaling up of the events I have not reviewed — this is what I actually verified, projected forward in time.
Is that plausible?
New York’s red-light camera programme is restricted by state law to 150 active intersections6. In FY24 the Department of Finance issued 694,878 violations under code 7, “failure to stop at red light”7. That is 12.7 tickets per camera intersection per day.
The confirmed rate of 76 crosswalk infractions per intersection per day is 6.0 times that — and standing in a crossing is the “lesser” infraction of the two. That gap is the whole point: the behaviour the city already enforces is the rarer one.
NYC DOT has some numbers here: it describes 150 locations (with the red light cameras) as “about 1% of signalized intersections” and a proposed expansion to 1,325 locations as “~10%”6, which puts the city’s signalised total at roughly 13,250.
| Scope | Intersections | Confirmed infractions / year | At $115 each |
|---|---|---|---|
| This inquiry | 6 | 165,750 | $19.1 M |
| If all 150 red light camera sites were used | 150 | 4.14 M | $477 M |
These numbers are projections, and definitely not realistic. But it feels nice to dream, so I shall. So in this dream scenario, we’d earn the city $477M per year from just 150 intersections which have the technology to track these infractions.
7. What should happen
1. Track it. The city does not currently measure crosswalk obstruction at all. It will not appear in Vision Zero reporting, in street redesign prioritisation, or in any budget line, because there is no field for it in the crash record and no programme that observes it. It is easy and cheap to measure. The infrastructure — red light cameras at 150 intersections — already exists. If I can do it at home, why can’t the city?
2. Enforcement as a means, not a revenue line. The 13% decline in right-angle injury crashes at red-light camera sites6 is the strongest available evidence that this behaviour class responds to consistent, impersonal enforcement. The desired outcome is an empty crosswalk that pedestrians can use unencumbered. But the money would be nice; we really need the cash for the esplanade on the East River. It’s literally free money!
Reproducibility
Everything needed to check this work is published: camera identifiers, the hand-drawn calibration geometry, every threshold, and the full record of what failed. Each reported incident has a reviewable clip.
Collection window: Wednesday 12 August 2026, 21:54 to Thursday 13 August 2026, 22:00 — 24.10 hours, six cameras, 253,451 unique frames.
References
- 1Traffic Rules, Title 34, Chapter 4 of the Rules of the City of New York. §4-03(a)(3)(i) (steady red signal); §4-07(b)(2) (spillback), quoted verbatim. The Rules are published by American Legal Publishing, which NYC DOT designates as the source of record; the wording above was checked against DOT’s own published Traffic Rules document for Title 34 Chapter 4. https://codelibrary.amlegal.com/codes/newyorkcity/latest/NYCrules/0-0-0-63676
- 2New York State Vehicle and Traffic Law §1175, “Obstructing traffic at intersection”. Quoted verbatim. https://www.nysenate.gov/legislation/laws/VAT/1175
- 3New York City Department of Finance, Parking Violation Codes, NYC Open Data dataset
ncbg-6agr. Code 50 (crosswalk) $115; code 52 (intersection) $115; identical for Manhattan 96th St and below and all other areas. https://data.cityofnewyork.us/City-Government/DOF-Parking-Violation-Codes/ncbg-6agr - 4U.S. Census Bureau, American Community Survey, 2024 1-year estimates. Table B08201 (Household Size by Vehicles Available) and Table B08301 (Means of Transportation to Work), New York County and NYC counties. https://data.census.gov/
- 5New York City Police Department, Motor Vehicle Collisions – Crashes, NYC Open Data dataset
h9gi-nx95. Calendar year 2024: 91,316 collisions; 9,616 pedestrians injured; 124 pedestrians killed. https://data.cityofnewyork.us/Public-Safety/Motor-Vehicle-Collisions-Crashes/h9gi-nx95 - 6New York City Department of Transportation, NYC Red Light Camera Program Reauthorization. Programme restricted to 150 active intersections (“about 1% of signalized intersections”); proposed expansion to 1,325 (“~10%”); nearly 13% decline in right-angle injury crashes comparing three years before and after installation; 54% increase in daily violations since 2020; 29 deaths in red-light-running crashes in 2023. https://www.nyc.gov/html/dot/downloads/pdf/nyc-red-light-camera-program-reauthorization.pdf
- 7New York City Department of Finance, Annual Report of New York City Parking Tickets and Camera Violations (Local Law 6 report), FY2024. Total issued: 16,092,421 violations, $1,087,813,644. Violation code 7, “failure to stop at red light”: 694,878 issued. https://www.nyc.gov/assets/finance/downloads/pdf/24pdf/2024-local-law-6-report.pdf